5 minutes
Diving Into Team Metrics
Every other week, my team gathers to partake in a particular ceremony. It goes something like this:
- One of us pulls up a story from our backlog and summarizes the goals and expected outcome of the card.
- Another one of us starts counting down 3…2…1…
- All of us show our hands, with some arbitrary number of fingers in the air.
These numbers sort of disappear into the ether after this peculiar ceremony, until a couple week later, I see a chart that looks something like this:
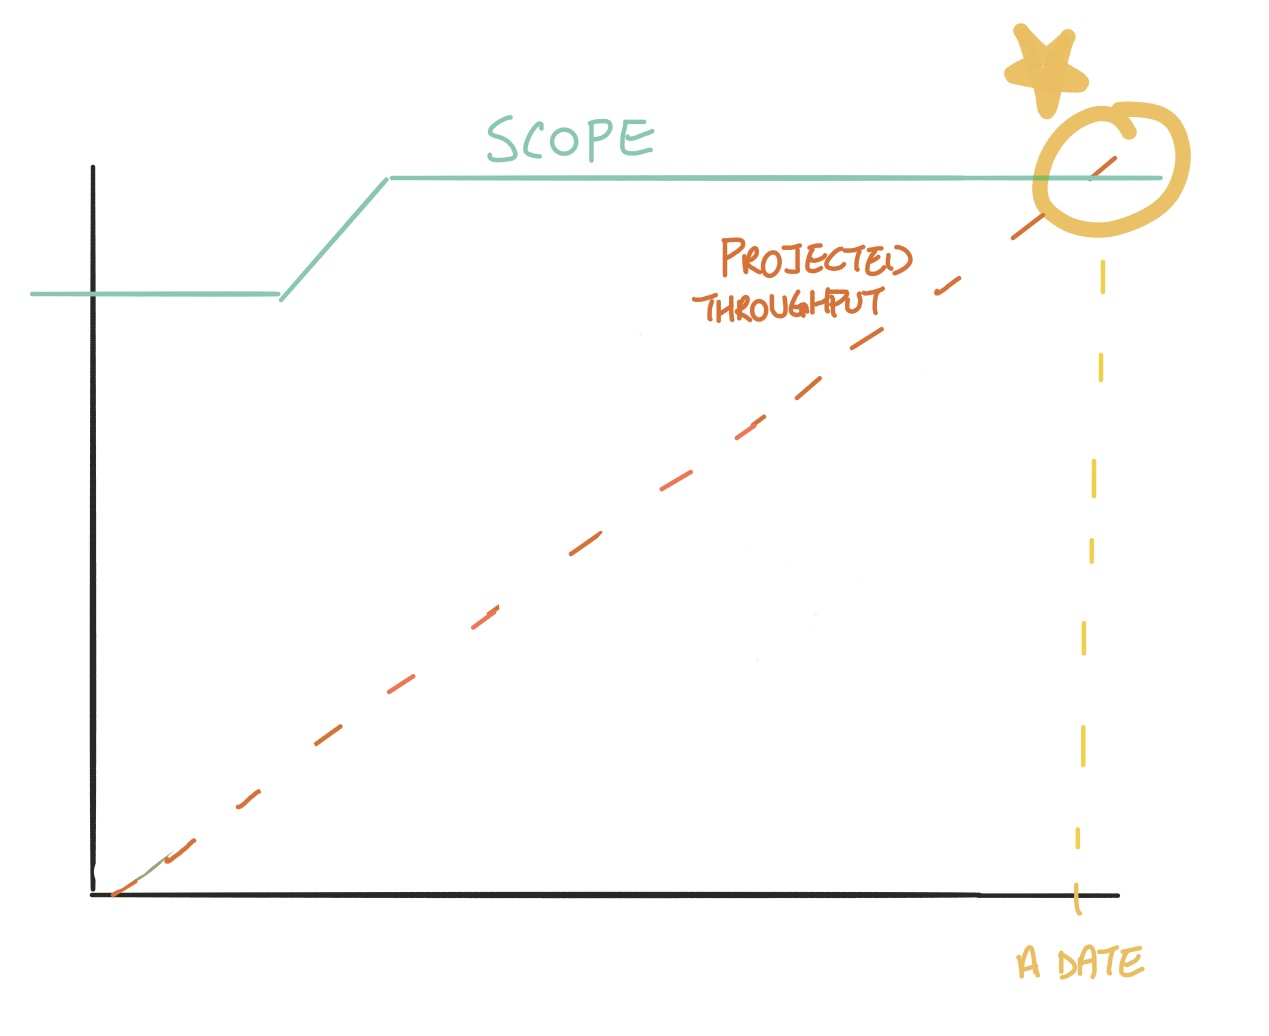
Ah-ha! That’s where these numbers had gone! The numbers from the items we completed get averaged to give birth to the linear trajectory that eventually intersects with the horizontal line at the top. This intersection is magical to everyone in the room, for it means we have a date.
Except. We know reality looks something more like this:
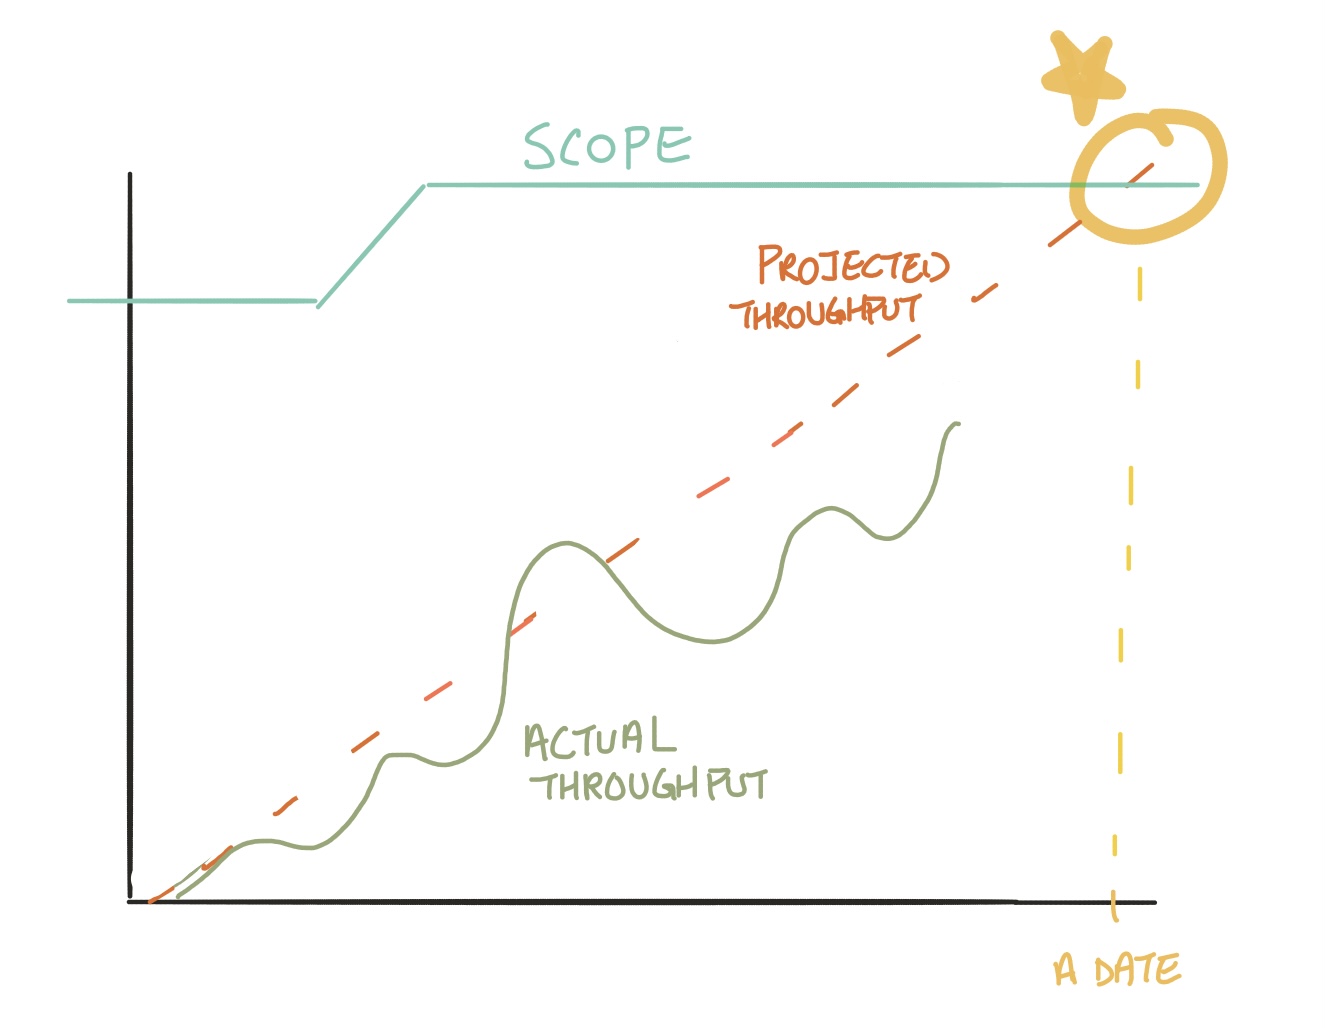
But that’s ok! Because, at the end, things will work out close to the average. Right…?
The issue with averages
There’s one big issue with averages: extremes are disproportionally represented.
There’s a quote that summarizes this amazingly:
When Bill Gates walks into a bar, everyone in the bar is a millionaire.
Here’s an example of two software teams with the same “average” velocity
Team A completed 4, 10, 4 items each week in the past 3 weeks
Team B completed 6, 6, 6 items each week in the past 3 weeks
Now, if both teams are aiming to complete 6 items next week, which team are you more confident will achieve their goal?
My guess is team B because they’ve been more consistent in the past.
Using cycle time to understand consistency
Cycle time answers how long it takes for a single item to go through a stage.
On my team, I usually look at the cycle time for each item from the time a developer (or pair) begins development, to when that same item is done (i.e. available in production).
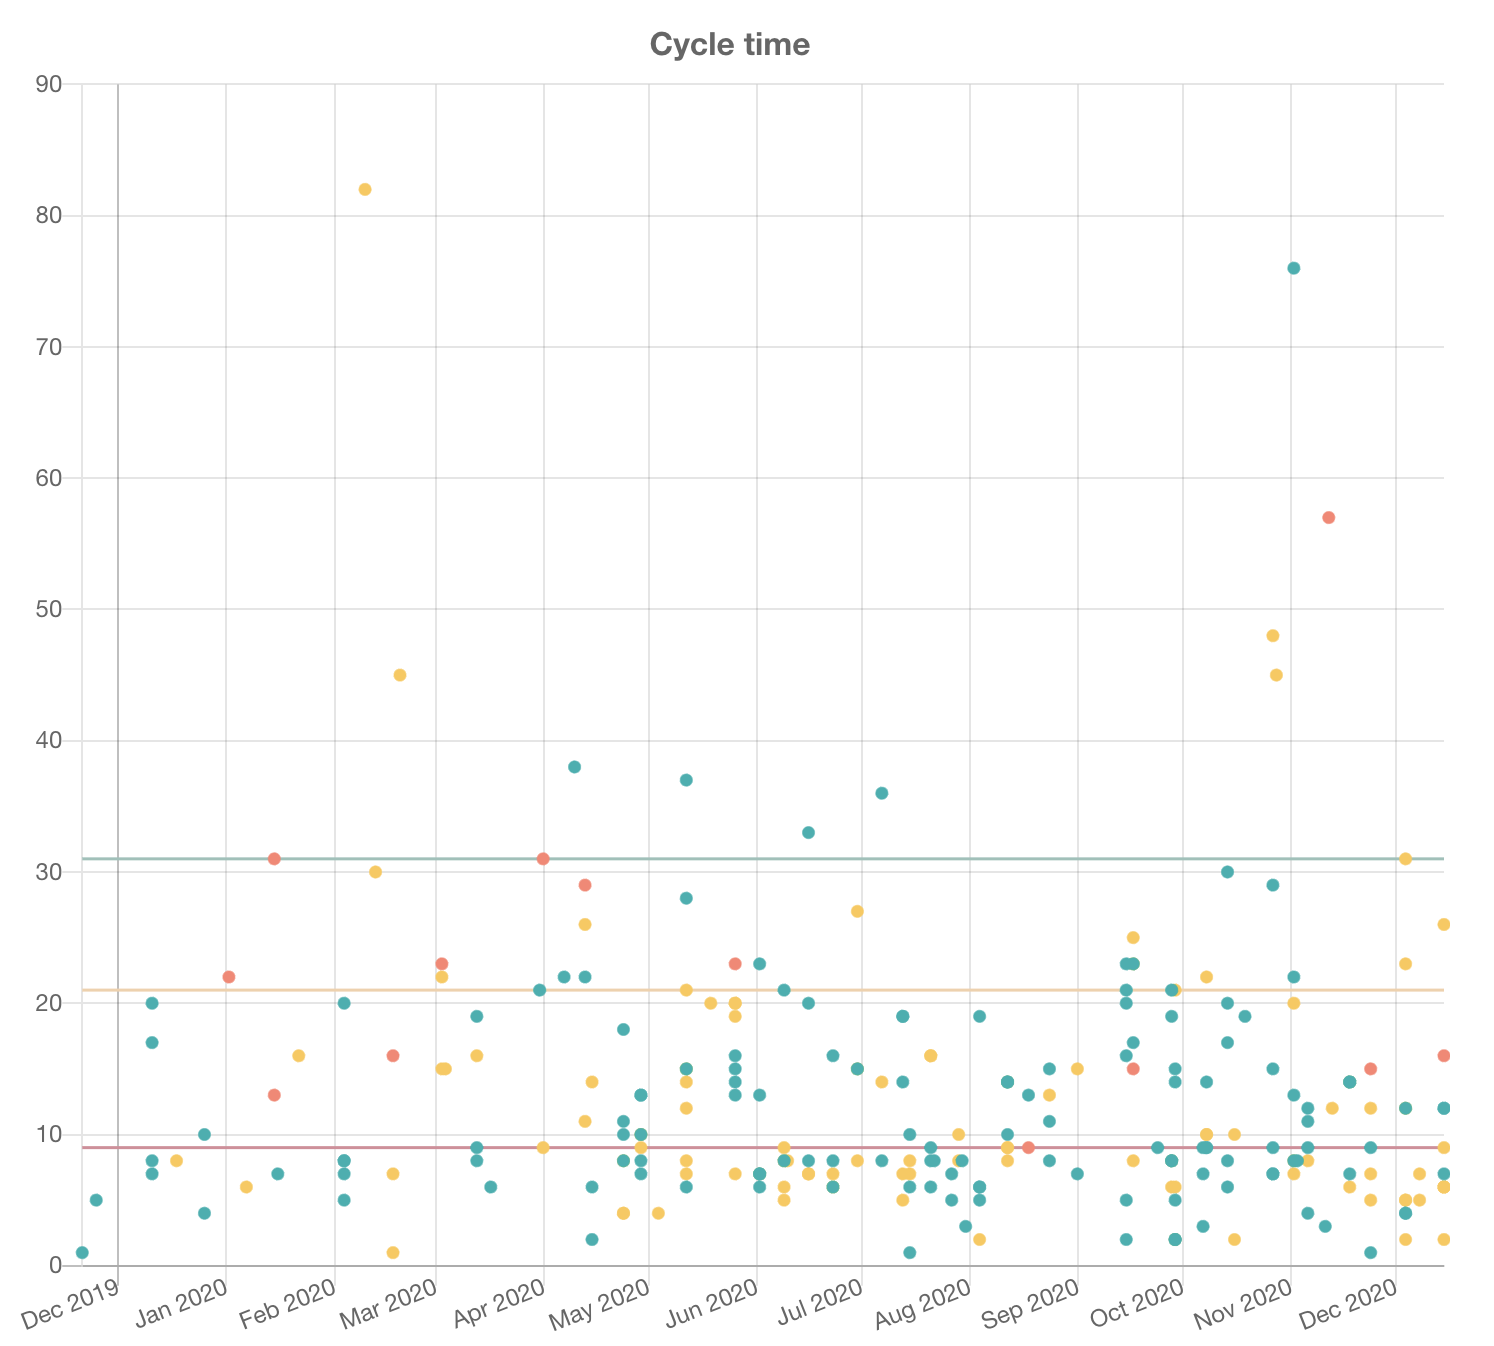
Plotting everything out, I can see that, historically,
- 50% of the items takes 8 days or less to be done
- 85% of the items takes 21 days or less to be done
- 95% of the items takes 31 days or less to be done
This view lets you know when a particular item took longer than normal to complete. Reflecting on an iteration can be hard, since many things could have impacted the output over that period.
However, reflecting on particular items narrows that scope significantly and allows your team to critically evaluate your process or bottleneck, and improve those areas.
With the distribution of our cycle time, we can definitely say which items are outliers and do retrospective on those items.
If we wish to improve our process and become more efficient, we can revisit our cycle time data to see if the implemented changes have succeeded.
So, when will it be done?
This is a million dollar question (sometimes literally, considering the cost of software projects).
Traditional burn-up charts use the average velocity to project towards a defined amount of scope + contingency.
However, we just saw that average doesn’t really paint a good picture of a team’s actual flow efficiency. Without a good baseline, how much can we trust any extrapolation based from it?
As a developer, I always get somewhat uncomfortable looking at a burn-up. It always seems too optimistic. And while dates are good and necessary, a single date makes me nervous.
We saw earlier that reality isn’t linear. Well, probably fair to say that any estimation of future flow is likely to be non-linear as well.
The good news is, there’s at least one other thing we can try to project future outputs.
Throughput
Knowing how long each item takes to get to done helps us understand how consistent we are. However, looking at individual items doesn’t account for what a team accomplishes together over a period.
For that, we’d look at throughput, the number of items completed over a defined period.
Blow is the throughput over a course of a month:
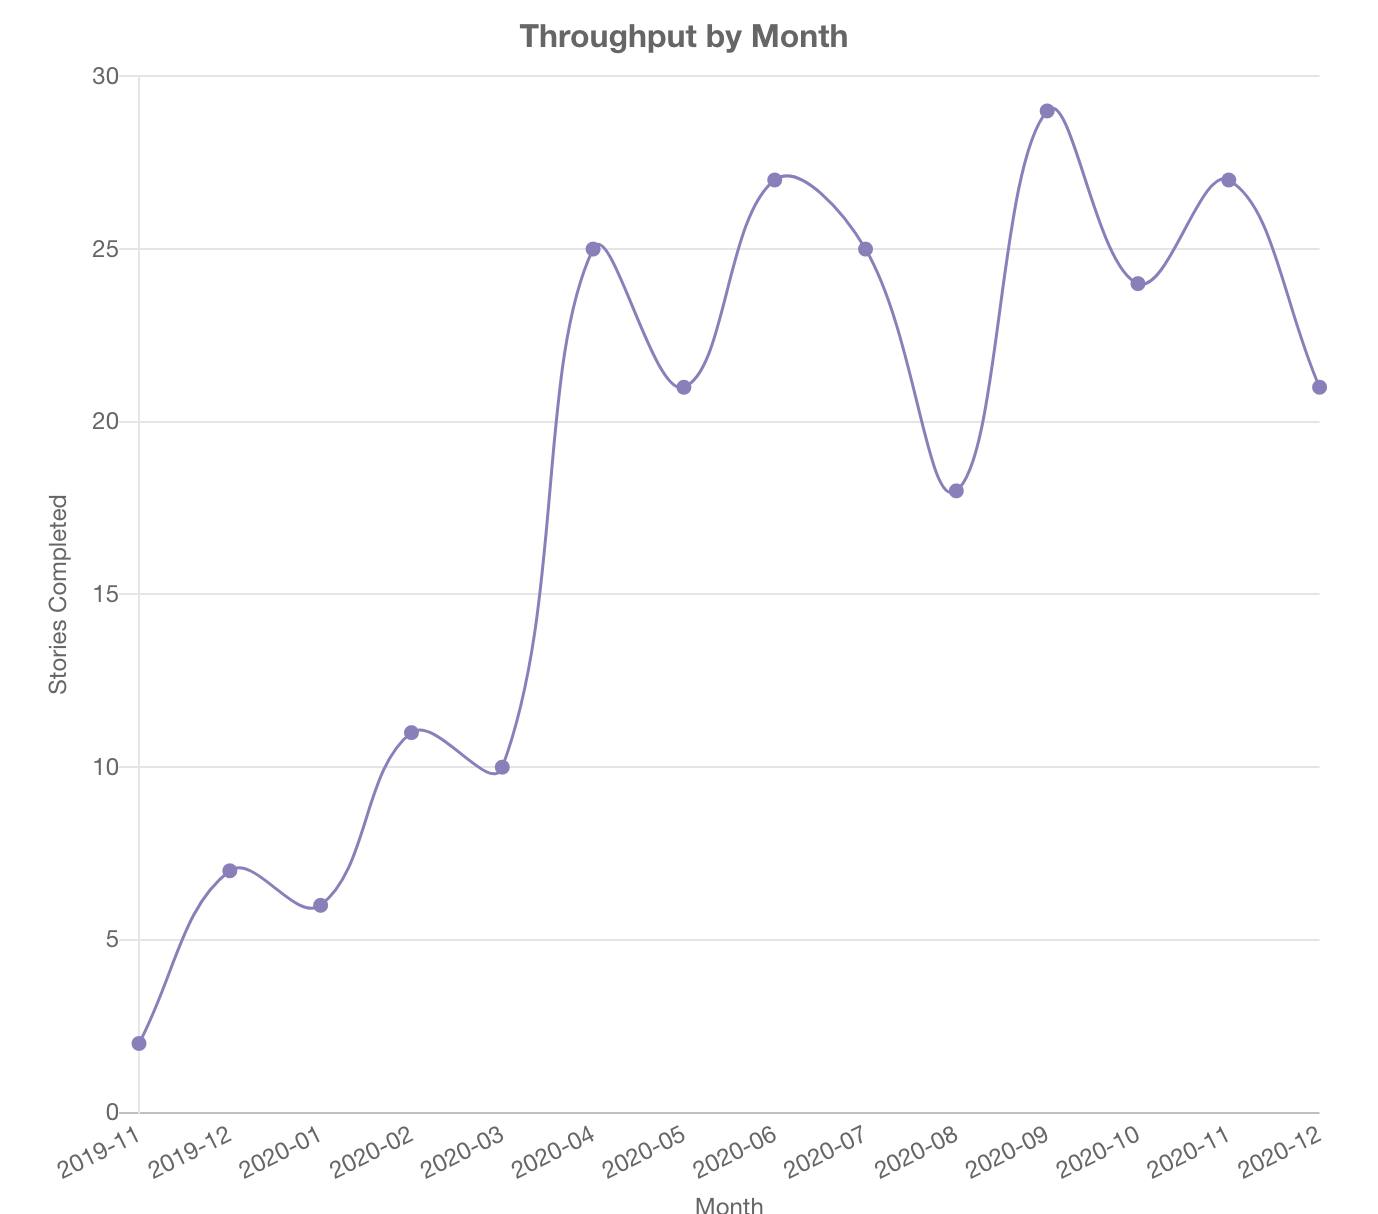
It’s common for teams to see ups/downs in their throughput (also represented by the curves in the burups), due to various factors in the delivery process.
Some of these factors are within the control of the team, like story quality and efficiency that comes with a team becoming more familiar with each other and with the tech.
Some factors are outside of the team’s controls, like delays working with dependencies, people movements, or simply other unexpected issues.
Monte Carlo Simulation
Monte Carlo simulations are used to model the probability of different outcomes in a process that cannot easily be predicted due to the intervention of random variables. – Investopedia
There’s a lot of variables that could affect the output of a team when looking into the future. Some of which are outlined above, though by no means exhaustive.
It’s hard to predict or factor in all the randomness, but there’s one dataset which already factored them in: the team’s historical data.
Monte Carlo Simulation runs n simulations, each one tracking how long it will take to reach your defined scope based on your historical throughput. The more simulation run, the better; my default is 10,000. At the end, you’ll end up with a probabilistic distribution that looks something like this:
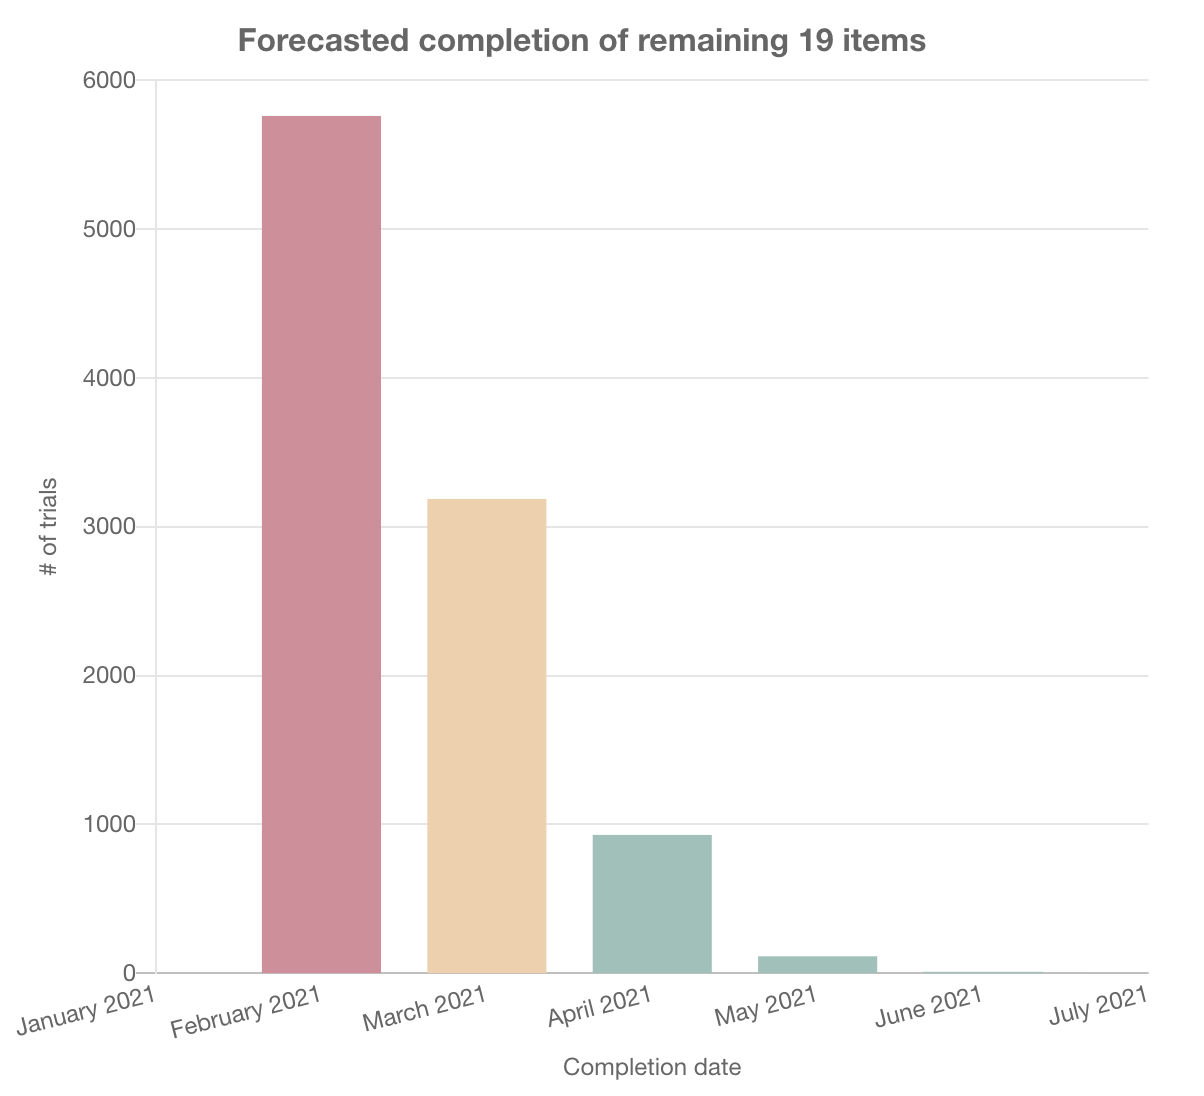
From here, you can come to probable summaries with confidence levels like these:
- we’re 0% confident we can complete the remaining scope in January 2021
- we’re 50% confident we can complete the remaining scope in February 2021
- we’re 85% confident we can complete the remaining scope in March 2021
- we’re 95% confident we can complete the remaining scope in April 2021
Conclusion
Distributions of your past data allows for more room to ask more interesting questions than simple average allows. Breaking down the data into individual items gives you the ability to track how consistent your team is with its own flow efficiency, and make it obvious which items are outliers versus which ones aren’t.
Monte Carlo Simulation offers another way outside of averages to forecast into the future. I haven’t personally used this on any teams, but I’m excited to incorporate it into the new team I’ve just joined.